
As the investment market continues to change, old trading strategies are constantly being eliminated and new strategies emerge. On the contrary, some of the most classic and simplest trading strategies have always been popular, such as the following 4 strategies.
Moving Averages
Moving average is a technical analysis tool that smooths out price data by creating a constantly updated average price. On a price chart, a moving average creates a single, flat line that effectively eliminates any variations due to random price fluctuations.
The average is taken over a specific period of time–10 days, 20 minutes, 30 weeks, or any time period the trader chooses. For investors and long-term trend followers, the 200-day, 100-day, and 50-day simple moving average are popular choices.
There are several ways to utilize the moving average. The first is to look at the angle of the moving average. If it is mostly moving horizontally for an extended amount of time, then the price isn’t trending, it is ranging. A trading range occurs when a security trades between consistent high and low prices for a period of time.
If the moving average line is angled up, an uptrend is underway. However, moving averages don’t make predictions about the future value of a stock; they simply reveal what the price is doing, on average, over a period of time.
Crossovers are another way to utilize moving averages. By plotting a 200-day and 50-day moving average on your chart, a buy signal occurs when the 50-day crosses above the 200-day. A sell signal occurs when the 50-day drops below the 200-day. The time frames can be altered to suit your individual trading timeframe.
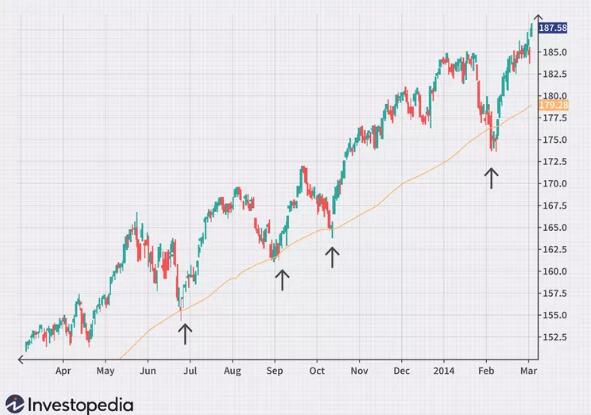
When the price crosses above a moving average, it can also be used as a buy signal, and when the price crosses below a moving average, it can be used as a sell signal.
However, since the price is more volatile than the moving average, this method is prone to more false signals, as the chart above shows.
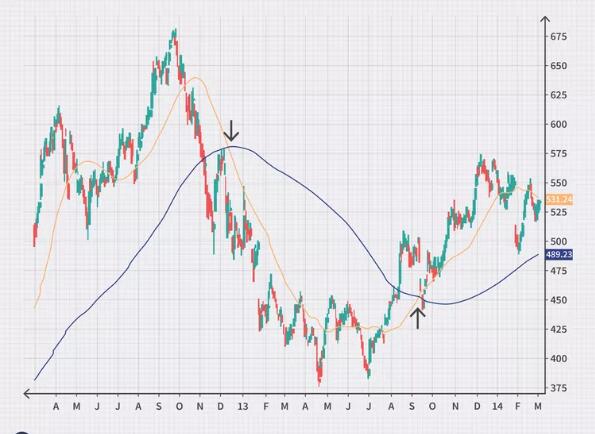
Moving averages can also provide support or resistance to the price.1 The chart below shows a 100-day moving average acting as support (i.e., the price bounces off of it).
Moving Average Convergence Divergence (MACD)
The moving average convergence divergence (MACD) is a kind of oscillating indicator. An oscillating indicator is a technical analysis indicator that varies over time within a band (above and below a centerline; the MACD fluctuates above and below zero). It is both a trend-following and momentum indicator.
One basic MACD strategy is to look at which side of zero the MACD lines are on in the histogram below the chart. If the MACD lines are above zero for a sustained period of time, the stock is likely trending upwards. Conversely, if the MACD lines are below zero for a sustained period of time, the trend is likely down. Using this strategy, potential buy signals occur when the MACD moves above zero, and potential sell signals when it crosses below zero.
Signal line crossovers can also provide additional buy and sell signals. A MACD has two lines—a fast line and a slow line. A buy signal occurs when the fast line crosses through and above the slow line. A sell signal occurs when the fast line crosses through and below the slow line.
Relative Strength Index (RSI)
The relative strength index (RSI) is another oscillating indicator but its movement is contained between zero and 100 so it provides different information than the MACD.
One way to interpret the RSI is by viewing the price as “overbought”—and due for a correction—when the indicator in the histogram is above 70, and viewing the price as oversold—and due for a bounce—when the indicator is below 30.
In a strong uptrend, the price will often reach 70 and beyond for sustained periods of time. For downtrends, the price can stay at 30 or below for a long time. While general overbought and oversold levels can be accurate occasionally, they may not provide the most timely signals for trend traders.
An alternative is to buy close to oversold conditions when the trend is up and place a short trade near an overbought condition in a downtrend.
For example, suppose the long-term trend of a stock is up. A buy signal occurs when the RSI moves below 50 and then back above it. Essentially, this means a pullback in price has occurred. So the trader buys once the pullback appears to have ended (according to the RSI) and the trend is resuming. The 50-levels are used because the RSI doesn’t typically reach 30 in an uptrend unless a potential reversal is underway. A short-trade signal occurs when the trend is down and the RSI moves above 50 and then back below it.
Trendlines or a moving average can help establish the trend direction and in which direction to take trade signals.
On-Balance Volume (OBV)
Volume itself is a valuable indicator, and on-balance volume (OBV) takes a significant amount of volume information and compiles it into a single one-line indicator. The indicator measures cumulative buying and selling pressure by adding the volume on “up” days and subtracting volume on “down” days.
Ideally, the volume should confirm trends. A rising price should be accompanied by a rising OBV; a falling price should be accompanied by a falling OBV.
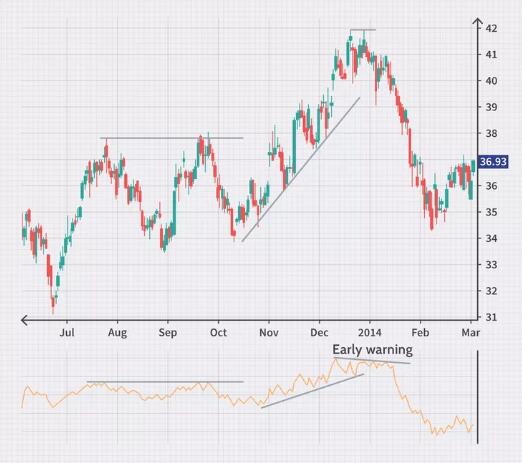
The figure below shows the shares of Netflix Inc. (NFLX) trending higher along with OBV. Since OBV didn’t drop below its trendline, it was a good indication that the price was likely to continue trending higher even after the pullbacks.
If OBV is rising and the price isn’t, it’s likely that the price will follow the OBV in the future and start rising. If the price is rising and OBV is flat-lining or falling, the price may be near a top. If the price is falling and OBV is flat-lining or rising, the price could be nearing a bottom.
The Bottom Line
Indicators can simplify price information, in addition to providing trend trade signals and providing warnings about reversals. Indicators can be used on all time frames, and for the most part, they have variables that can be adjusted to suit each trader’s specific preferences. Traders can combine indicator strategies–or come up with their own guidelines–so entry and exit criteria are clearly established for trades.
Learning to trade on indicators can be a tricky process. If a particular indicator appeals to you, you may decide to research it further. Most importantly, it’s a good idea to test it out before using it to make live trades. And for those who have never actively traded before, it’s important to know that opening a brokerage account is a necessary first step in order to gain access to the stock market.